
Introduction

Power BI (power business intelligence) is a collection of software services, applications, and connectors that work together to transform relevant data sources into coherent, visually realistic, interactive insights. No matter whether the user's data is a simple Excel spreadsheet or a collection based on cloud and local hybrid data warehouse, Power BI allows users to easily connect to the data source, visualize (or discover) important content, and share it with anyone they want.
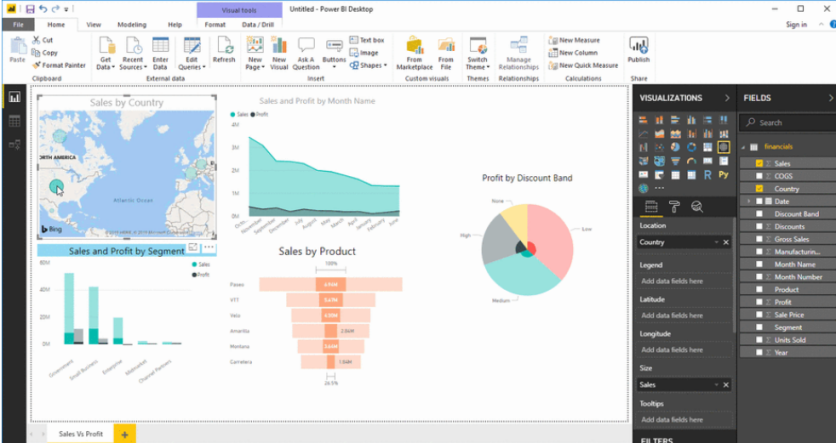
Power BI is simple and fast, and can create quick insights from Excel spreadsheets or local databases. At the same time, Power BI can also perform rich modeling, real-time analysis, and custom development. Therefore, it is not only a personal report and visualization tool for users, but also serves as an analysis and decision-making engine behind group projects, departments, or the entire enterprise.
Power-BI is currently divided into two product systems:
(1) Power-BI Standard Solution
For mainstream ERP versions such as Kingdee (EAS, K3, KIS Professional Edition)/UFIDA (NC, U9, U8, T6, T3)/Shenma (Yituo, Yifei)/SAPB1, with rich and practical analysis models preset, available upon installation, lowering the threshold of BI technology and popularizing BI applications to the public.
(2) Power-BI Green Development Platform
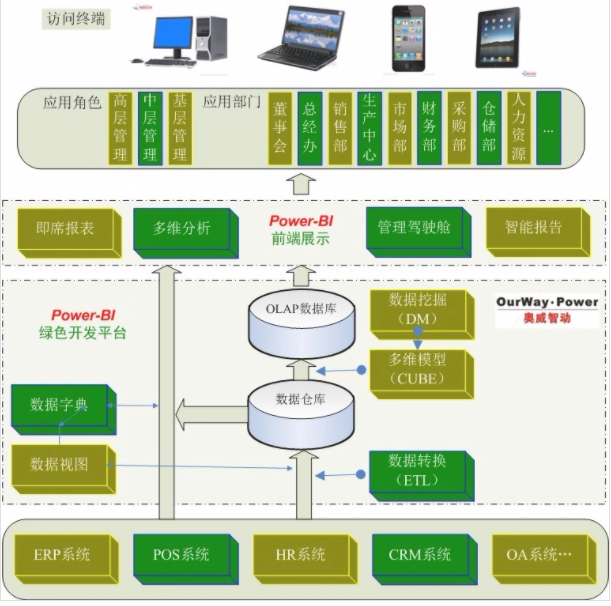
(2) Power-BI Green is a platform product. Through a series of functions such as data view management, data conversion management, OLAP database management, multi-dimensional report design, ad hoc report design, etc., it can quickly help enterprise IT personnel build multi-dimensional analysis models, make ad hoc reports, make analysis reports, and Release management cockpit and other BI applications on the basis of existing ERP/CRM and other information systems. Color development platform
![]()

Power-BIзҡ„жҠҖжңҜжЎҶжһ
![]()
Introduction to the Functions of Power-BI Green Development Platform
1. Data View Management
Through Data dictionary and data view management, the database structure of ERP CRM OA and other information systems can be translated into business language, and the association relationship between tables involved in different business topics can be fixed. In this way, the report and analysis model developers no longer need to spend a lot of time studying the business and data logic of ERP CRM OA and other information systems, but only need to drag the fields needed for analysis, SQL query scripts can be automatically generated, ultimately enabling non IT professional business personnel to easily design reports and analysis models. Can connect to any data source, such as SQL Server, Oracle, MySQL, Informix, Excel, OLAP, etc.
2. Data Conversion Management
Through data transformation management, massive data can be extracted, transformed, and loaded (ETL) into a data warehouse through full and incremental data update strategies based on different analysis themes from any data source.
3. OLAP Database Management
After extracting the source data into the data warehouse through data transformation, the analysis model is created based on the analysis requirements. At this point, the model designer can quickly create an OLAP database by answering three questions. 1) What content should be analyzed? 2) From which dimensions should we analyze? 3) Where do these data come from?
4. Multidimensional Report Design
Quickly design and manage cockpit and multi-dimensional analysis reports by dragging and dropping with the mouse. The data can be sourced from OLAP databases or SQL queries. Can achieve multi chart linkage, with more flexible presentation methods, and can design any analysis path management cockpit/Flash dashboard.
Quickly define a management cockpit containing Flash controls by dragging and dropping the mouse. The Flash controls provided by the system include: pointer dial, traffic lights, thermometer, bar chart, cone chart, funnel chart, profit analysis, volume cost profit analysis, digital map, etc.
5. Multidimensional report browsing
After publishing multidimensional reports, browsing users can perform dynamic analysis through mouse operations, achieving the magical effect of turning an analysis model into dozens of reports. Scheme management has always been a unique feature of Power-BI. As long as you drag and drop the report style with the mouse, it can be saved as a scheme. It can not only be private but also shared with other users, making it easy for each user to personalize.
6. Intelligent analysis report design
Through simple settings, you can define a WORD/PPT analysis report with both text and graphics, which can read different data sources. It integrates trend analysis, structural analysis, year-on-year analysis, factor analysis, ranking analysis, any table, personalized custom SQL, custom MDX, and other analysis methods, allowing you to choose from any table, graph, or text.
It only needs to click on a button, and dozens of pages of complex content, illustrated and illustrated, with any topic and analysis method of WORD/PPT analysis report can be completed in 1-2 minutes. Liberate the manual workload of managers, allowing them more time to think about the meaning behind numbers and propose improvement measures.
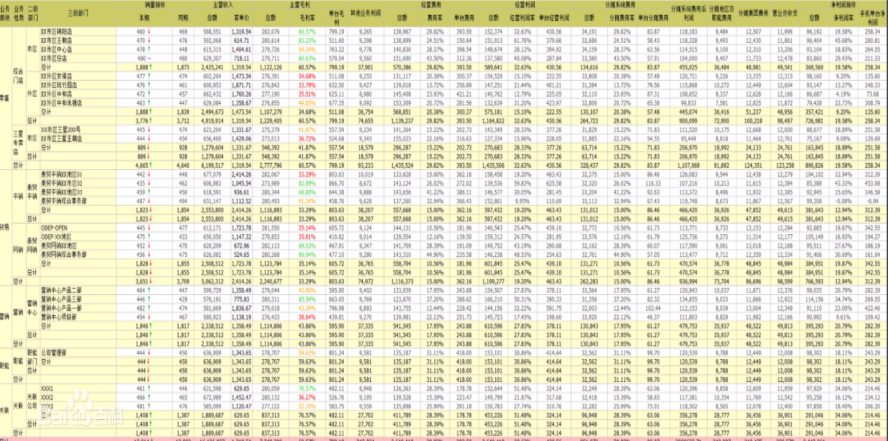
7. Ad hoc report design
Power-BI provides a simple wizard mode, coupled with a visual design interface, which allows for quick design of various forms of reports, and allows for easy drilling and linking between reports. At the same time, the report subscription center can send designed reports or alerts to users' email or mobile phones. Report desktop: If a leader wants to open their computer, the KPIs they are following can be displayed on the desktop, without logging into a system to query reports, and can be updated regularly. Report Discussion Area: When discussing the content of the same report, everyone can freely express their opinions or comments.
![]()
8. Security Management System
For decision analysis systems, the security of the system and data is crucial. Power-BI has a powerful and simple security management system. It includes functional permissions for both the development and browsing ends, as well as data permissions for browsing users. Answer three questions: Which users can enter the system? What menus (reports) can each user see? What data can each user see?
Power-BI's data authorization display is intuitive and easy to operate. You only need to set which table to authorize data based on, and then select different users to check which data has permissions.
9. Green BI community
Introduction to BI, home for BI enthusiasts. Build a BI green ecological community.
Green is to eliminate waste of resources, and so is technological resources. To build a BI green ecological community, it is necessary to enable developers to develop excellent BI solutions and applications at the minimum cost.
The Power-BI development version not only provides users with a simple and unimaginable user experience during the BI design process, but also utilizes the wisdom of all BI developers with its unique design.
In order to maximize the reuse of achievements, the community will release the Data dictionary and data view of mainstream ERP, so as to reduce your research time. Meanwhile, practitioners from different industries can upload their practical achievements to the community platform for everyone to download and utilize. In this way, the green BI community will become a treasure trove of wisdom for everyone, where everyone can share the achievements of others and also allow others to share their own achievements.
GcExcel is compatible with SpreadJS front-end and back-end, and can directly import SSJSON format. Without relying on Office, POI, and third-party software, it meets the requirements of online document front-end and back-end data synchronization, online reporting, batch export and printing on the server, as well as Excel like report template design and high-performance processing on the server. It provides a complete set of Excel like full stack solutions for your developed applications.